To make a pie chart in Google Sheets, begin by opening your desired spreadsheet. This visual representation can dramatically enhance your data interpretation and presentation.
Step 1: Access Google Sheets
Navigate to Google Sheets and select the spreadsheet you wish to use for your pie chart.
Step 2: Highlight Your Data
Click and drag over the cells that contain the data you want to display in your pie chart. This selection will form the basis of your visual data representation.
Step 3: Initiate the Chart Creation
With your data selected, access the ‘Insert’ menu at the top of your screen, then select ‘Chart’ to begin crafting your pie chart.
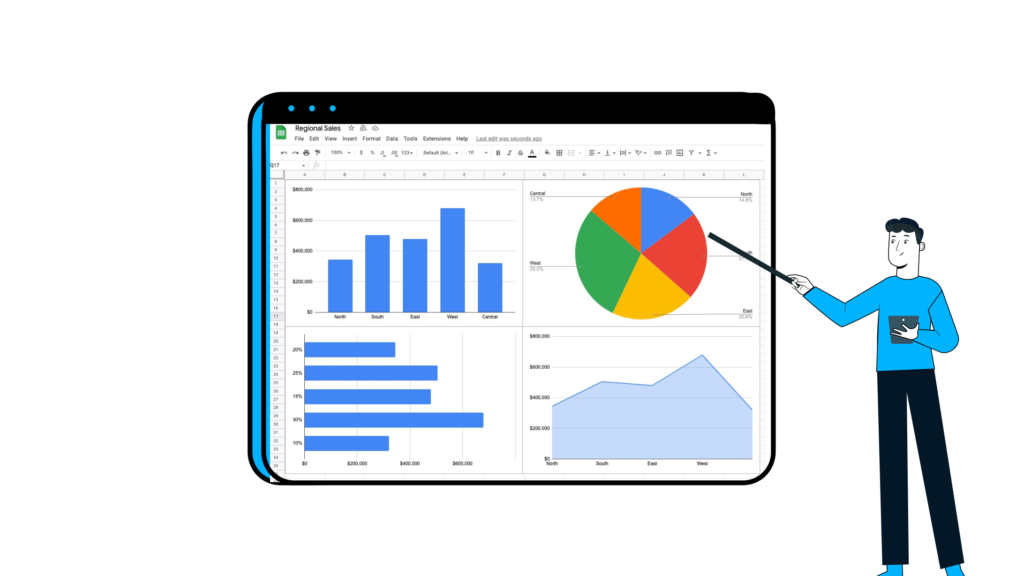
Choosing the Right Chart Type
In the chart editor that appears, ensure you select ‘Pie chart’ from the available options. You may also consider alternative styles such as doughnut or 3D pie charts for a unique touch.
Step 4: Customize Your Chart
After selecting your chart type, move to the ‘Customize’ tab in the Chart Editor. Here, you can alter the chart’s aesthetic elements like background color, font style, and border color to better fit your presentation needs.
Detailed Customization Options
Within the customization menu, you have the ability to adjust the chart title, labels, colors, and more to ensure your chart communicates your data as clearly as possible.
Step 5: Apply and Share Your Chart
Once you are pleased with the customization, click ‘Apply’ to save your changes. Your pie chart is now ready to be shared. You can embed it within a website, share it directly via a link, or download it as an image for offline use.
Data Visualization Made Simple
This guide is designed to assist you in quickly creating effective pie charts within Google Sheets, enhancing both your data analysis and presentation capabilities. For further exploration, feel free to delve into more advanced features and customization options available in Google Sheets.
| Task | Tool | Description |
|---|---|---|
| Chart Selection | Google Sheets Menu | Select ‘Pie Chart’ from the Chart Editor. |
| Data Customization | Customize Tab | Modify visual elements like colors and fonts. |
| Sharing Options | Google Sheets Features | Embed, link, or download your chart. |